LiveView Pro Course Update: Charting Demo
October 16, 2020
Hey friends, we’re baaack!
Hope you’re continuing to get a lot of value from the free LiveView course.
Last month we announced that we were beginning work on a LiveView Pro course as an extension of the free Starter course. We were excited about it, but didn’t know what you’d think of the idea. So we asked…
And WOW, we were blown away by your enthusiasm for the Pro course! Many thanks for all the encouraging 👍, 🥳, and 💯 responses. We’re sincerely humbled and grateful for your continued support.
So it’s game on!
We’ve taken all your suggestions, reprioritized a few topics, and have been working diligently on the course. OK, we might have played hooky a few days to go fishing and enjoy the beautiful fall weather. Nevertheless, we’re making good progress and have some examples we’re ready to start showing.
Here’s where we need your help. As the course progresses, we’ll send updates with behind-the-scenes looks at what we’re working on. It would be tremendously helpful if you’d let us know if what you see is aligned with what you need (or not). The more input we get from you, the better the course will be. Because, after all, we’re making the course for you!
Without further ado, here’s the first behind-the-scenes peek.
Many of you asked for an example of a LiveView that charts data using a JavaScript library such as Chart.js.
So we’ve been working on a time-series chart that automatically updates every hour. Just to make it interesting, we’re charting a person’s blood sugar level. Don’t worry, you don’t have to hook anything up to a human body to make it work. 😉
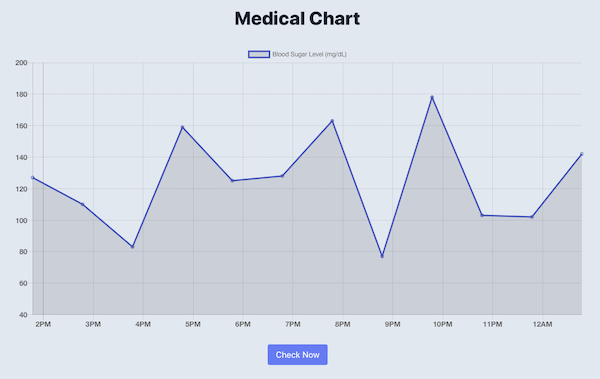
It’s a rolling 12-hour time-series chart.
It starts out with an initial set of data points for the previous 4 hours. But instead of having to wait an hour to see the next data point appear, through the magic of programming we sped up time. So every second a new data point is automatically added. At any time you can also manually check the current blood sugar level which adds a new data point to the chart.
And yes, this person’s blood sugar is all over the place! It wouldn’t vary that wildly over a 12-hour period. But using a random value within a range makes for a more interesting chart.
The domain is irrelevant.
While this example is for medical data, very little of the code is specific to that domain. Simply by changing the labels and x-y values you could chart performance metrics, polling data, or ice cream sales. Indeed, the type of data and where it comes from is irrelevant.
What is relevant is how the data gets passed from the LiveView to the JavaScript charting library.
And that’s the sole focus of this example: the LiveView-JavaScript touchpoints. The techniques are the same regardless of the data or even which JS charting library you use.
So how does it work?
Given what you’ve already learned in the infinite scrolling example, you probably guessed that charting involves using a JavaScript hook. And you’re absolutely right! The difference with charting is that the data is flowing the other way.
In the infinite scrolling example, the JavaScript pushed an event to the LiveView running on the server to tell it to load more results. Charting is the other way around. The LiveView needs to push an event to the JavaScript so that a new data point is added to the chart. The LiveView also needs to pass the initial set of data points to the graph when it’s hooked in.
So this example teaches us something new, building on what we already know.
Now it’s your turn!
-
Is this the kind of thing you’re wanting to do?
-
Any changes that would make this example more useful?
-
Did we overlook anything that would be generally applicable?
Thanks again for your interest in the Pro course! 🤟